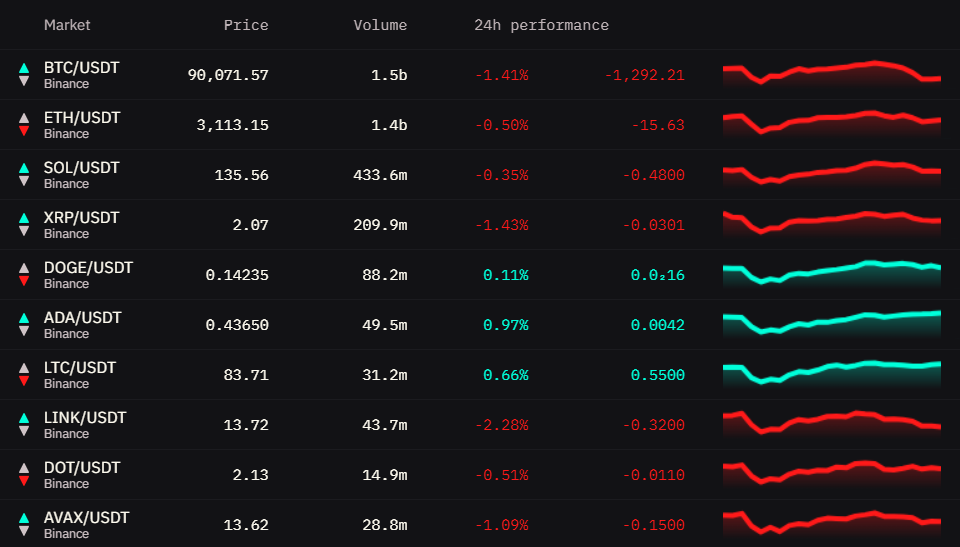
The Watchlist widget allows you to track multiple cryptocurrency pairs simultaneously in an organized table view. It displays current prices, trading volumes, 24-hour performance metrics, and mini price charts for quick visual analysis across all your monitored markets.
Market Compatibility
The Watchlist widget supports any combination of markets without restrictions.
You can mix:
- Different trading pairs (BTC/USDT + ETH/USD + SOL/USDC)
- Different exchanges (Binance + Coinbase + Kraken)
- Different market types (Spot + PERP + Futures)
- Any combination of the above
This makes Watchlist ideal for monitoring diverse portfolios and comparing performance across different assets.
Interface
The Watchlist displays markets in a table format with the following columns:
Market Column
Shows the trading pair and exchange.
Price Column
Displays the current market price - the last traded price on that exchange.
Format: Formatted with appropriate decimal places based on price magnitude
- High-value coins: $96,234.50
- Mid-value coins: $3,421.23
- Low-value coins: $0.00234
Combine with Ticker Widget: For detailed price action with charts and more metrics, add a Ticker widget for specific markets you’re actively monitoring.
Volume Column
Shows 24-hour trading volume for the selected market.
What it represents: Total amount of the base asset traded in the last 24 hours
Why it matters: High volume = high liquidity and easier entry/exit. Low volume = potential slippage and harder to trade large sizes.
24h Performance Column
Displays price change over the last 24 hours as both percentage and absolute value.
Color coding:
- Green: Current price is higher than 24h ago
- Red: Current price is lower than 24h ago
- Gray/White: No significant change (~0%)
Note: Green and red colors mentioned are from the default theme. Your active theme may use different colors for bid (buy) and ask (sell) sides.
Quick scanning: This column helps you immediately identify which markets are moving and in what direction.
Mini Chart Column
Visual representation of price movement over the last 24 hours.
Benefits:
- Quick visual pattern recognition
- See if current price is at high/low of the day
- Identify trending vs ranging markets
- No need to open full charts for quick overview
For Detailed Analysis: Mini charts are great for quick overview. For in-depth technical analysis with indicators and drawing tools, use the Orderbook Heatmap widget’s full charting capabilities.
Responsive behavior: When widget width is limited, some columns may hide automatically to preserve essential data. Make the widget wider to restore all columns.
Interactions
These interactions are unique to the Watchlist widget.
Column Sorting
Click any column header to sort the entire watchlist by that metric.
Available sorting:
- Market - Alphabetical order (A→Z or Z→A)
- Price - Lowest to highest or highest to lowest
- Volume - Lowest to highest or highest to lowest
- 24h Performance - Worst performers to best or best to worst
How to use:
- Click column header once - sorts ascending (↑)
- Click same header again - sorts descending (↓)
- Click different header - switches to that column
Visual indicator: Active sort column shows arrow indicating direction (↑ or ↓)
Use cases:
- Find highest volume markets for better liquidity
- Identify top gainers/losers of the day
- Compare prices across exchanges for same pair
Tip: Sort by 24h performance to quickly find opportunities - big movers often continue momentum in short term, while extreme moves might indicate reversal zones.
Manual Reordering
When no sorting is active, you can manually drag markets to arrange them in your preferred order.
How to use:
- Ensure no column sorting is active (click any active sort header twice to clear)
- Hover over a market row
- Click and drag the row up or down
- Drop in the desired position
Why use this: Organize markets by your personal strategy:
- Put most-watched markets at top
- Group similar assets together (all BTC pairs, all alts, etc.)
- Arrange by your trading priority
Note: If you apply column sorting, your custom order is temporarily overridden. Clear the sort to return to your custom arrangement.