Order flow trading means making decisions based on the actual buying and selling activity happening in the market — not price patterns, moving averages, or other derivatives of price. You’re reading the orders themselves: who is trading, at which price, and in what quantity.
This guide covers everything: what order flow is, how it differs from technical analysis, which tools you need, and how to build real order flow trading strategies in crypto markets.
What Is Order Flow Trading?
Order flow trading is the practice of analyzing the stream of buy and sell orders to understand market dynamics before price reacts to them.
Every price move in any market is caused by order flow — by the aggregate of all orders being executed. Technical analysis looks at the result of that activity (price and volume charts). Order flow trading looks at the activity itself: the limit orders resting in the book, the market orders hitting them, and the resulting absorption or continuation of price.
In practical terms, order flow traders watch:
- The order book — where limit orders are sitting, and how they change
- Time & sales / tape — the real-time stream of executed trades
- Footprint charts — candlesticks that show buy/sell volume at every price level
- Order book heatmap — historical visualization of where orders were placed over time
- Liquidations — forced position closings that create predictable order flow
The goal is to answer: who has control right now, buyers or sellers — and is that control likely to continue or reverse?
Order Flow Trading vs Technical Analysis
| Technical Analysis | Order Flow Trading | |
|---|---|---|
| Data source | Price & volume history | Live order book + executed trades |
| Lag | Always lagging | Real-time |
| What it shows | Where price was | Where orders are and what’s happening now |
| Best for | Identifying structure, trends, levels | Execution timing, short-term reversals, confirmation |
| Tools | Moving averages, RSI, Bollinger Bands | Footprint, DOM, order book heatmap, tape |
Most professional traders use both. Technical analysis defines the structure and context. Order flow provides the precise entry and exit timing within that structure.
A common approach: use technical analysis to identify a key support level, then use order flow to confirm actual buying absorption at that level before entering — instead of blindly buying at a price zone.
Core Order Flow Trading Concepts
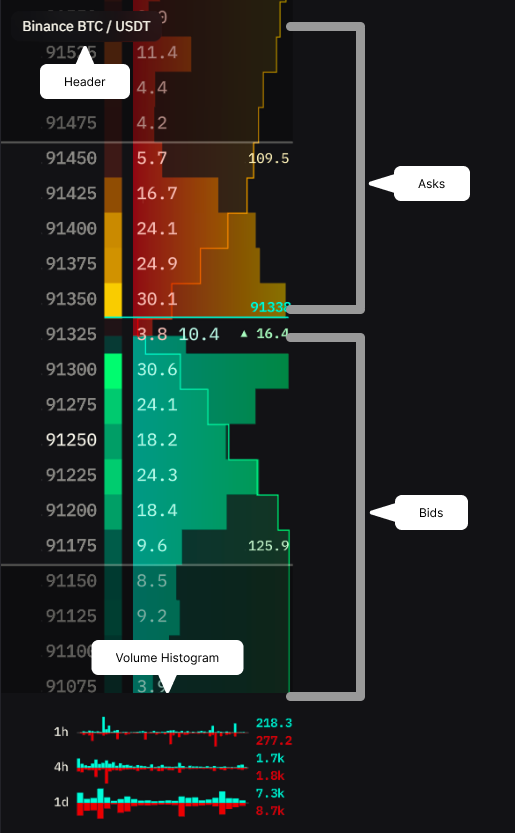
The Order Book (DOM)
The Depth of Market (DOM) or order book shows all pending limit orders at every price level — how many contracts or coins are queued to buy or sell. This is the supply and demand picture before execution.
Key things to watch in the DOM:
- Large limit orders (bid/ask walls) — potential support/resistance if they hold
- Order book imbalances — when one side has dramatically more size than the other
- Order pulling — large orders disappearing right before price reaches them (a sign the order was placed for show, not intent)
- Stacking vs. thinning — when size builds or disappears on a side as price approaches
The DOM shows intent that hasn’t executed yet. It’s directional information, but must be read carefully — spoofing (placing and canceling large orders to manipulate perception) is common.
Time & Sales (The Tape)
The tape is the real-time feed of every executed trade: price, size, direction (buy or sell), and timestamp. Unlike the DOM, the tape shows what actually happened — not just what was offered.
Tape reading is one of the oldest forms of order flow analysis, originating in the Jesse Livermore era of stock ticker reading. The modern version shows:
- Aggressive buys — market orders hitting the ask (buyers taking the offer)
- Aggressive sells — market orders hitting the bid (sellers taking the bid)
- Block trades — unusually large single prints that indicate institutional activity
- Speed and pace — whether the tape is printing fast (urgency) or slow (hesitation)
An experienced tape reader can detect when a large player is distributing position through a series of seemingly small prints, or when a breakout is real vs. engineered.
Footprint Charts
Footprint charts (also called cluster charts or bid/ask volume charts) overlay the full order flow data directly onto candlesticks. Each candle becomes a grid: every price level shows how much volume traded on the buy side vs. the sell side.
This gives you:
- Delta — net buy minus sell volume for each candle (or each price level)
- Volume imbalances — price levels where buyers or sellers overwhelmed the other side by a significant ratio
- Points of Control (POC) — the price level with the most volume in a candle
- Unfinished auctions — when price reversed before the market could find two-sided business at a level
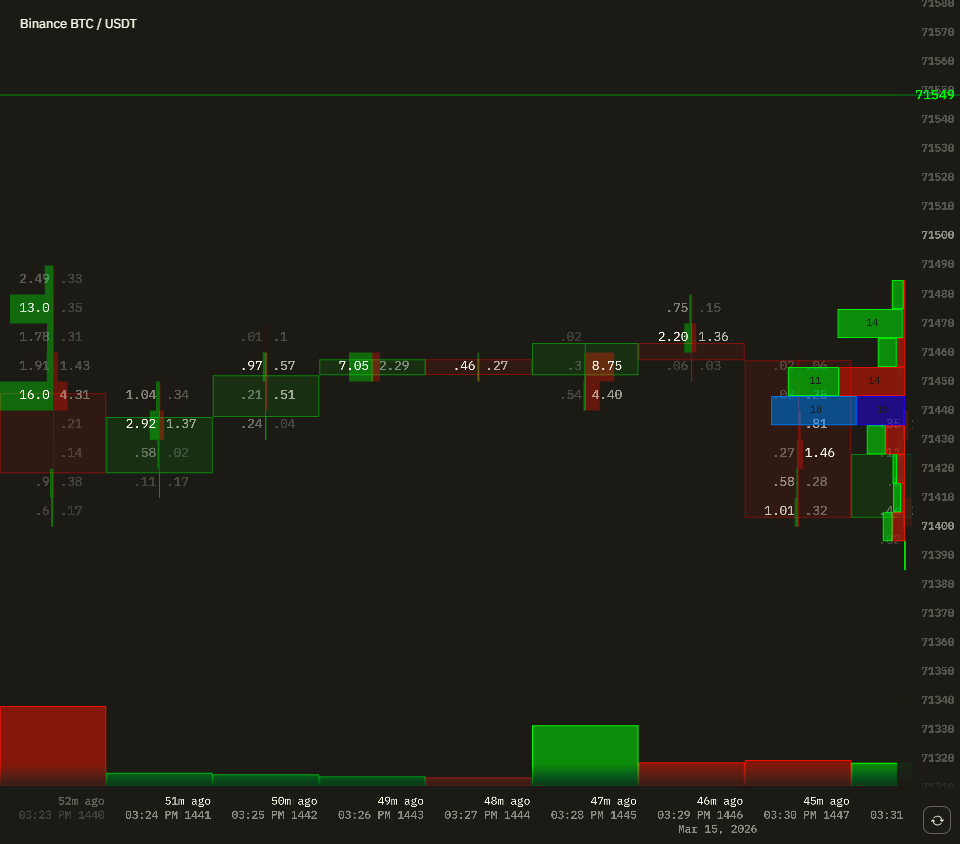
Footprints are particularly powerful for crypto because they reveal when a move is backed by real volume or is a thin-air price manipulation move. See the Footprint Chart guide for a deep dive into reading delta, imbalances, and POC.
Order Book Heatmap
An order book heatmap visualizes where limit orders have been placed over time, layered behind price action as a color-coded grid. Each cell represents order activity at a specific price level during a specific time window — the more orders sitting at that level, the more intense the color.
Unlike a standard DOM that shows the current snapshot of the order book, a heatmap shows the history: where big orders appeared, where they were pulled, and which levels held.
Key things to read in a heatmap:
- Dense clusters — price levels where large limit orders concentrate repeatedly. These act as magnetic zones — price tends to be drawn toward them and react at them.
- Order walls — thick horizontal bands of high-intensity color indicating large resting liquidity. These form visible support and resistance before price reaches them.
- Order pulling — zones that were dense but suddenly clear as price approaches, revealing spoofed orders placed to manipulate direction.
- Volume imbalances — combined with footprint numbers (executed trade volumes overlaid on candles), you can compare where orders were placed vs. where actual trades occurred.

The heatmap is especially powerful in crypto because large players often reveal their intent through resting orders before executing. Watching how the heatmap changes as price approaches a level — whether the wall holds, grows, or vanishes — tells you whether the level is genuine or manufactured. See the Order Book Heatmap guide for full configuration and usage.
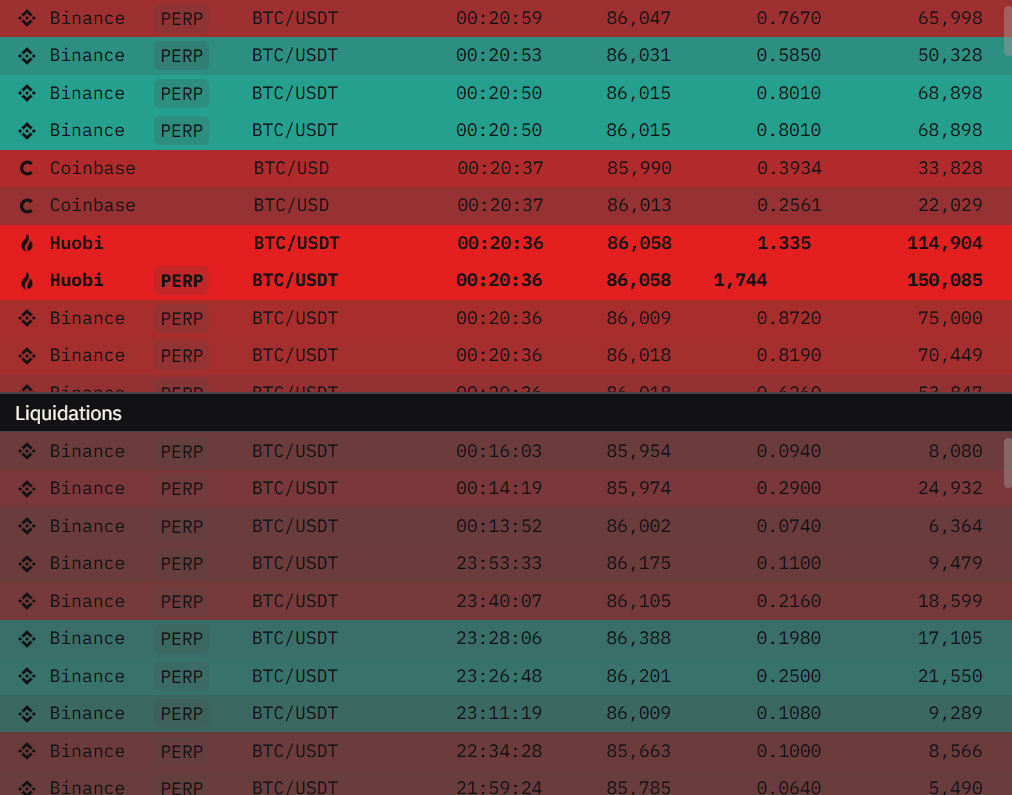
Liquidations
In crypto specifically, liquidation data is a uniquely powerful order flow signal. When leveraged traders are liquidated, their positions are forcibly closed — creating sudden, predictable bursts of order flow in one direction.
Key liquidation patterns:
- Liquidity hunts — price briefly spikes into a zone where stop-losses and liquidation triggers are clustered, then reverses sharply
- Cascade liquidations — one liquidation triggers the next, creating sustained directional flow
- Liquidation exhaustion — after a large liquidation event, the forced selling/buying is over and price stabilizes or reverses
Monitoring liquidation activity in the trade feed — especially clusters of large liquidations — lets you anticipate where price is being drawn before it gets there.
Order Flow Trading Strategies
Strategy 1: Absorption at Key Levels
Concept: Wait for price to reach a significant technical level (support, resistance, VWAP, previous high/low), then confirm actual buying or selling absorption before entering.
Setup:
- Identify the key level using technical analysis
- As price approaches, watch the footprint for large sell volume meeting large buy volume at the same price — buyers absorbing seller aggression
- Watch the heatmap — if the order wall at the level holds or grows, the level is defended
- Enter long when absorption is clear, stop below the level
What you’re seeing: Institutional buyers are sitting at the level, absorbing every market sell order that hits them. The level is defended, not just approached.
Strategy 2: Heatmap Wall Fade
Concept: Trade reversals when a visible order wall on the heatmap gets absorbed — price stalls at a large resting order cluster, volume piles in, then continues through.
Setup (bearish wall fade):
- Identify a dense heatmap zone above current price — large ask-side orders resting at a level
- As price approaches, watch the footprint for aggressive buying hitting the wall
- If the wall holds and buy volume begins to thin out, sellers are successfully defending
- Watch for a large delta-negative footprint candle confirming seller control
- Enter short, stop above the wall level
Edge: The heatmap shows where supply is concentrated before price reaches it. When price absorbs into a wall and stalls, the footprint confirms the rejection with hard data.
Strategy 3: Liquidation Hunt Entry
Concept: Identify clusters of stop losses and liquidation triggers, anticipate the hunt, and position for the reversal after the sweep.
Setup:
- Identify obvious technical levels where retail stops are clustered (clear previous lows/highs, round numbers)
- Watch tape for accelerating sell volume into the level (the hunt)
- Watch the order book heatmap — look for a large bid wall appearing below the sweep zone as bigger players position to absorb
- Look for immediate delta reversal in footprint — buyers absorbing the forced selling
- Enter long after the flush, tight stop below the sweep low
What you’re seeing: The sweep clears out weak hands, the forced selling creates cheap prices that larger buyers absorb immediately.
Strategy 4: Breakout Confirmation
Concept: Don’t trade breakouts on price alone — confirm them with order flow before entering.
Fake breakout signs:
- Footprint shows thin volume on the breakout candle (no participation)
- Large orders disappear from the ask on the heatmap as price reaches them (spoofed resistance)
- Tape prints are small and scattered — no urgency
Real breakout signs:
- High delta candles on the breakout (aggressive market buyers)
- Heatmap shows the resistance wall was absorbed — dense zone visibly consumed
- Volume in the tape accelerating, large prints confirming
- Previous resistance level now showing absorption buying on retest
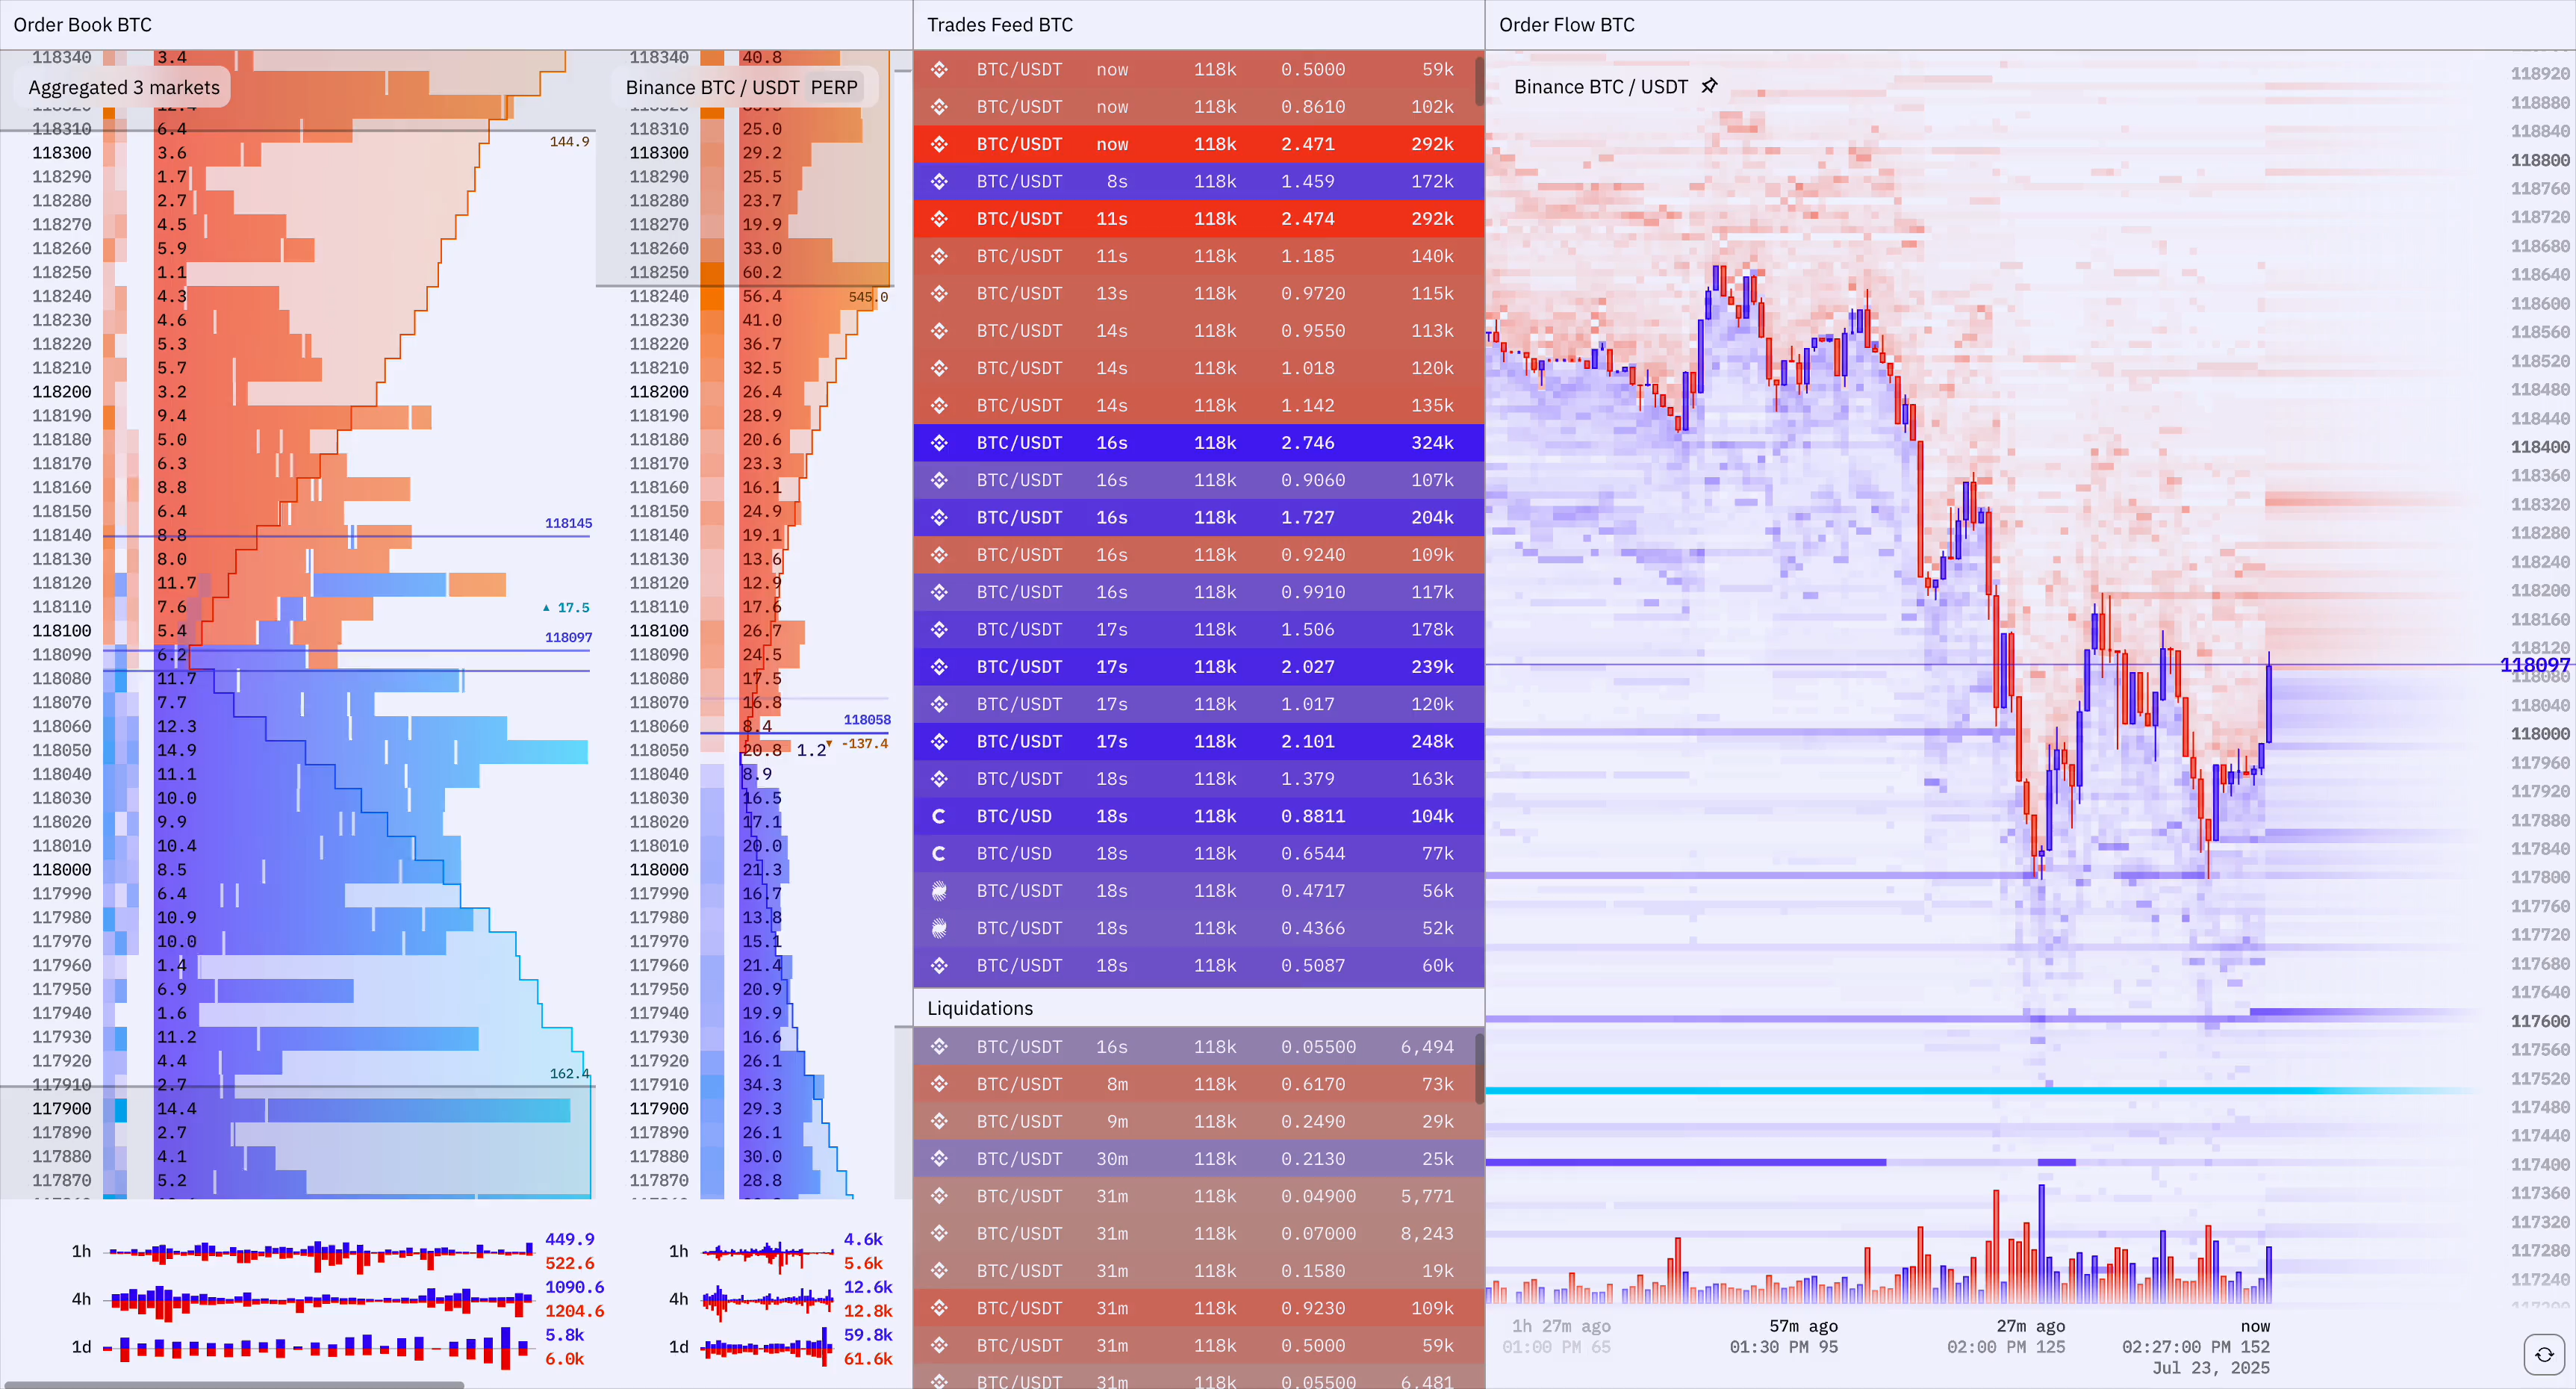
Order Flow Trading Tools for Crypto
What to Look for in an Order Flow Platform
Crypto order flow trading requires different tools than traditional futures trading:
- Multi-exchange aggregation — BTC trades across Binance, Bybit, OKX, Coinbase, and 10+ other venues simultaneously. Single-exchange data misses the full picture.
- Real-time data — order flow signals are useless with even 1–2 seconds of delay
- Footprint charts — essential for seeing the full bid/ask breakdown per candle
- Order book heatmap — historical visualization of where orders were placed over time
- Aggregated order book — cross-exchange DOM showing real combined liquidity
- Trade feed — real-time tape with size highlighting
TapeSurf
TapeSurf is built specifically for crypto order flow trading, aggregating data from 10+ exchanges simultaneously. Available in-browser — no download required.
Key widgets:
- Footprint chart with delta, imbalances, and volume profile
- Order book heatmap combining historical order placement with footprint volumes
- Order book / DOM — aggregated across multiple exchanges simultaneously
- Trade feed with size filtering and highlighting
NinjaTrader
Desktop platform and the industry standard for futures order flow (ES, NQ, crude oil). Excellent footprint (volumetric bars) and DOM. Acquired by Kraken in 2025 — now supports BTC and ETH futures, but no spot crypto or multi-exchange aggregation.
Bookmap
Specialized order book heatmap platform with strong crypto support across 20+ exchanges. Excellent real-time heatmap visualization and aggregated DOM. Strong for order book analysis, less focused on footprint than ATAS or NinjaTrader.
ATAS
Order flow platform with a dedicated crypto branch (ATAS Crypto) supporting Binance, Bybit, OKX, and others. Comprehensive footprint and cluster analysis tools. Desktop only, Windows only.
Common Order Flow Trading Mistakes
1. Reading static levels, not flow Order flow is dynamic. A large bid wall that was there 30 seconds ago may be gone now. Constantly refresh your reading rather than anchoring to what you saw.
2. Ignoring context Order flow signals work better in specific contexts. A footprint imbalance or heatmap wall at a major technical level is high-probability. The same signal in the middle of nowhere is noise.
3. Over-relying on DOM for entries The DOM shows intent, not commitment. Large orders are pulled and replaced constantly. The tape (executed trades) is more reliable than pending orders.
4. Trading crypto order flow with single-exchange data If you’re reading BTC order flow on Binance only, you’re seeing maybe 30–40% of actual market activity. Multi-exchange aggregation is essential.
5. Trusting the heatmap without confirming execution Large orders on the heatmap show intent, not commitment — they can be pulled before price arrives. Always confirm with footprint (what actually traded) before acting on a heatmap level alone.
Order Flow Trading vs Smart Money Concepts (SMC)
SMC (Smart Money Concepts) / ICT concepts are popular in retail trading communities. They use terms like “order blocks,” “fair value gaps,” and “liquidity sweeps.” Some of these concepts have overlap with order flow trading but there are important differences:
| SMC / ICT | Order Flow Trading | |
|---|---|---|
| Based on | Price pattern identification | Real-time volume and order data |
| Tools needed | Standard chart (no special data) | Footprint, DOM, heatmap, tape |
| Verifiability | Pattern-based, subjective | Data-based, objective |
| “Order block” | Identified by price pattern | Identified by actual volume at level |
| Liquidity sweep | Identified after the fact | Anticipated and timed with flow data |
Order flow trading isn’t better than SMC — they answer different questions. Many professional crypto traders use SMC to define structure and order flow to time entries within that structure.
Is Order Flow Trading Profitable?
Order flow trading provides a genuine information edge — you’re seeing real market activity that indicators don’t show. However:
- It has a steep learning curve. Reading the tape and footprints fluently takes months of practice.
- Context matters enormously. The same signal means different things depending on market conditions, session time, and overall trend.
- It works better in liquid markets. BTC and ETH provide the cleanest order flow signals. Lower-cap altcoins are too easily manipulated.
- Execution quality matters. Order flow signals are often short-lived. Poor execution infrastructure negates the edge.
Professional traders consistently report that order flow analysis — particularly multi-exchange aggregated footprint and order book heatmap — is one of the few genuinely non-lagging edges available in crypto markets.
Getting Started with Order Flow Trading
- Start with the heatmap. It’s visually intuitive — you immediately see where orders are concentrated. Watch how walls form, hold, and disappear as price approaches.
- Add the tape. Watch the trade feed alongside price. Learn to read the pace, size, and direction without overthinking it.
- Learn footprints last. Footprint charts have the highest information density. Start reading them after you’re comfortable with the heatmap and tape.
- Practice on replay. Before trading live with order flow, replay historical sessions and practice identifying setups.
- Focus on BTC. The clearest, most manipulated-by-institutions market in crypto. Order flow signals are strongest here.
- Use multi-exchange data. Single-exchange order flow for BTC or ETH is incomplete. Use a platform that aggregates across venues.
TapeSurf provides all order flow tools in one browser-based platform, aggregated across 10+ exchanges — start for free here.