The Ticker widget provides detailed real-time information for a single cryptocurrency market. It displays current price, 24-hour performance, price chart, and key orderbook metrics including bid/ask liquidity depth.
Market Compatibility
The Ticker widget displays one market at a time.
To monitor multiple markets, add multiple Ticker widgets to your board or use the Watchlist widget for a multi-market table view.
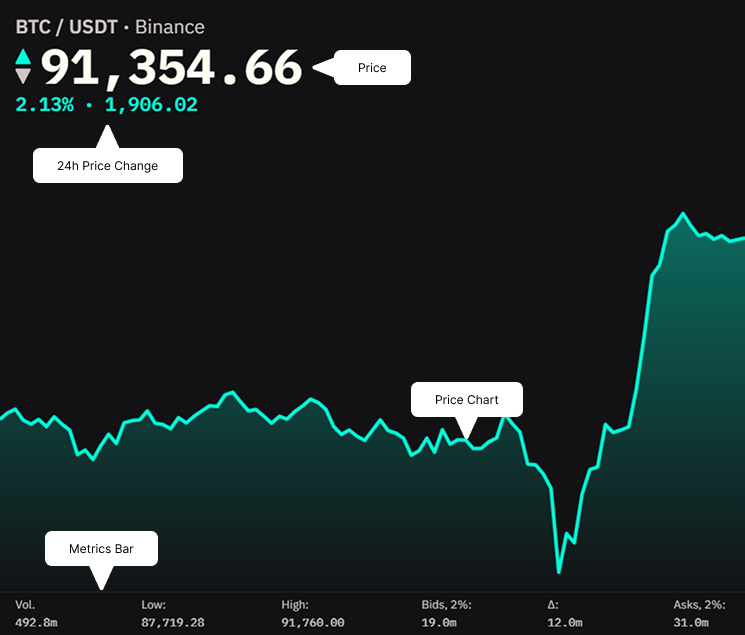
Interface
Header
Shows the trading pair and exchange.
Price Display
Large, prominent display of the current market price.
Format: Adjusted for price magnitude
- High-value: $92,394.46
- Mid-value: $3,421.23
- Low-value: $0.00234
24h Price Change
Shows price change over last 24 hours as percentage and absolute value.
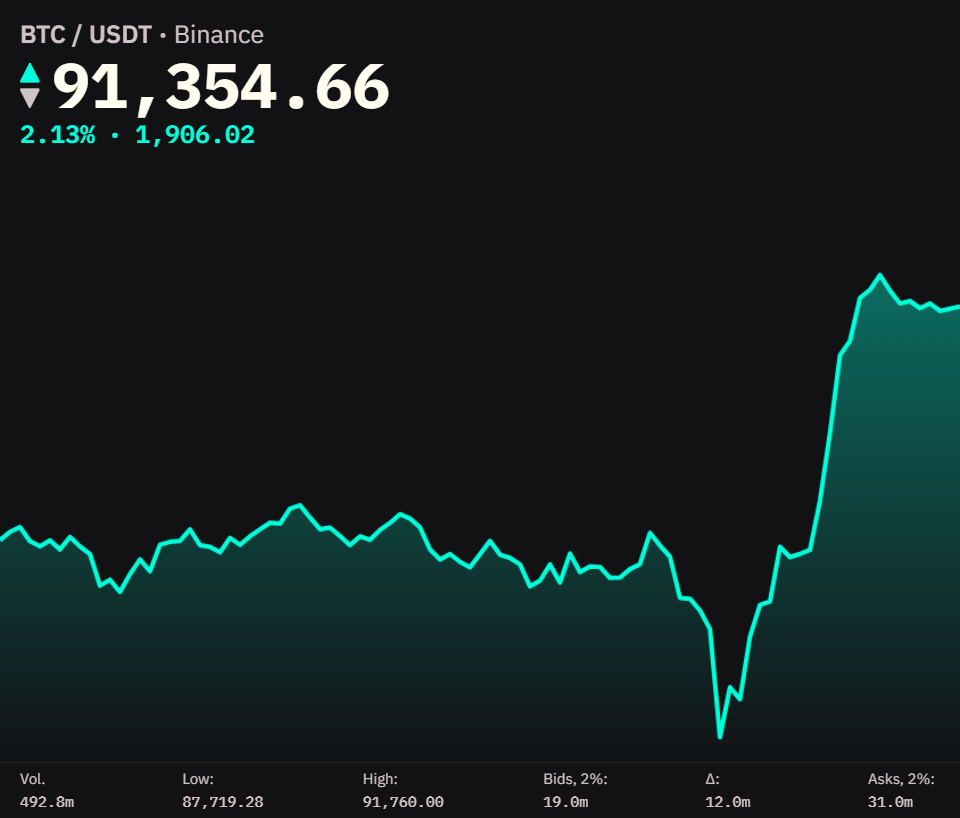
Price Chart
Visual representation of price movement over the last 24 hours.
Display:
- Area chart with gradient fill
- Color matches price direction relative to 24h ago (green if current price is higher, red if lower)
- Shows general trend and volatility pattern
Note: Green and red colors mentioned are from the default theme. Your active theme may use different colors for bid (buy) and ask (sell) sides.
Responsive behavior: The chart may hide automatically when widget width becomes too narrow. For space-constrained layouts, also consider Compact Mode.
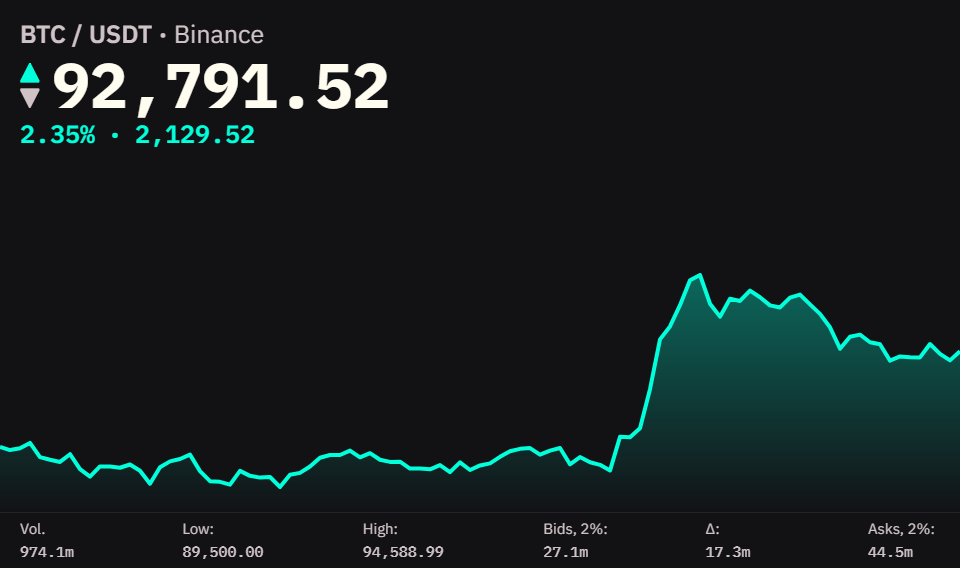
Metrics Bar
Displays key trading and orderbook metrics in a row at the bottom.
Vol. - 24-hour trading volume
- Total amount of base asset traded
- Higher = better liquidity
Low - Lowest price in last 24 hours
High - Highest price in last 24 hours
Bids, 2% - Total bid liquidity within 2% of mid price
- Volume available to buy within 2% below current price
- Higher = better support
Δ - Delta (difference between bids and asks)
- Positive = more bid liquidity (bullish pressure)
- Negative = more ask liquidity (bearish pressure)
Asks, 2% - Total ask liquidity within 2% of mid price
- Volume available to sell within 2% above current price
- Higher = stronger resistance
Reading Liquidity: Compare Bids and Asks to gauge market pressure. Large delta indicates imbalance - big positive delta suggests buying pressure, large negative suggests selling pressure. For deeper liquidity analysis, see the Order Book widget.
Settings
Compact Mode
Minimizes the widget to show only price and 24h change. Chart and metrics bar are hidden.
When to use:
- ON: Monitoring multiple markets in limited space, secondary markets you’re watching
- OFF: Active trading or detailed analysis, primary trading pair
| Compact Mode OFF | Compact Mode ON |
|---|---|
 |  |
Tip: Use compact mode for secondary markets you’re watching, full mode for your primary trading pair. For monitoring many markets at once, consider using the Watchlist widget.