The Trade Feed widget displays real-time cryptocurrency transactions as they occur across exchanges. It shows detailed information about each trade including the exchange, trading pair, price, quantity, and total value, allowing you to observe market activity and identify significant transactions in real-time.
Market Compatibility
The Trade Feed widget supports multiple markets with the same base and quote currencies.
Compatible:
- BTC/USDT (Binance) + BTC/USDT (Coinbase) - same pair, different exchanges
- BTC/USDT + BTC/USDC - same base, similar quote
- BTC/USDT (Spot) + BTC/USDT:PERP - compare spot and perpetual trades
Incompatible:
- BTC/USDT + ETH/USDT - different base currencies
- BTC/USDT + BTC/BNB - different quote currencies
This allows you to see all trades for the same asset across multiple venues in one stream. For monitoring trades across different pairs, use multiple Trade Feed widgets.
Interface
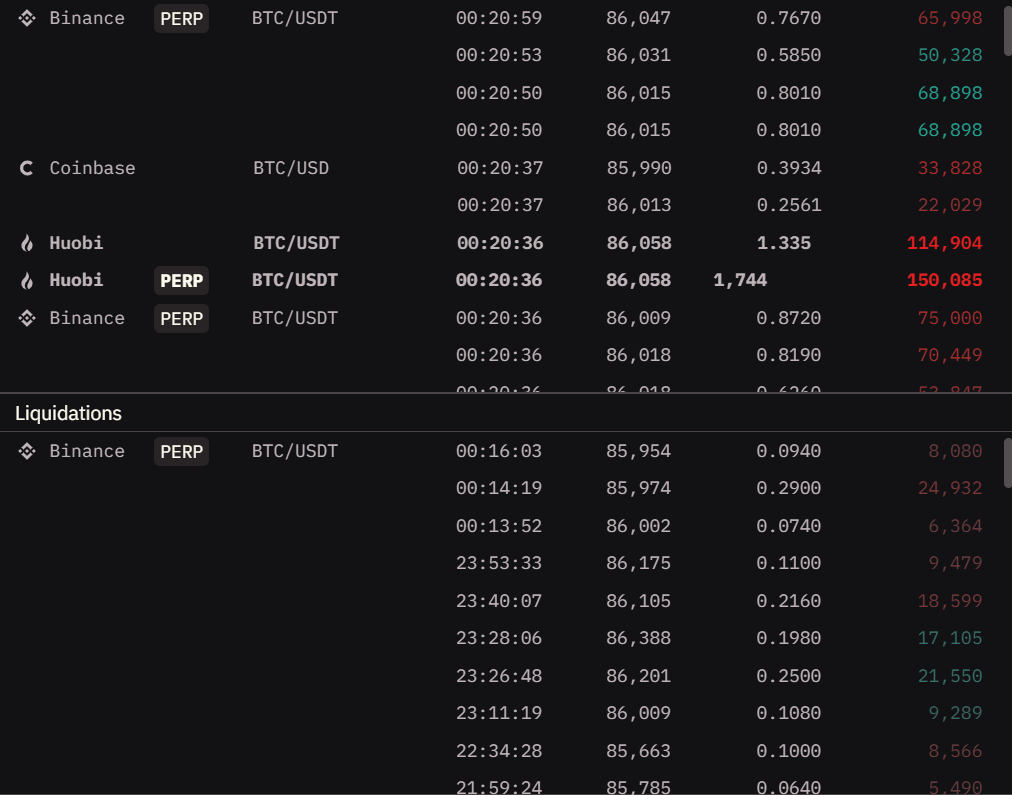
The Trade Feed displays transactions in a scrolling list format, with each row representing a single trade.
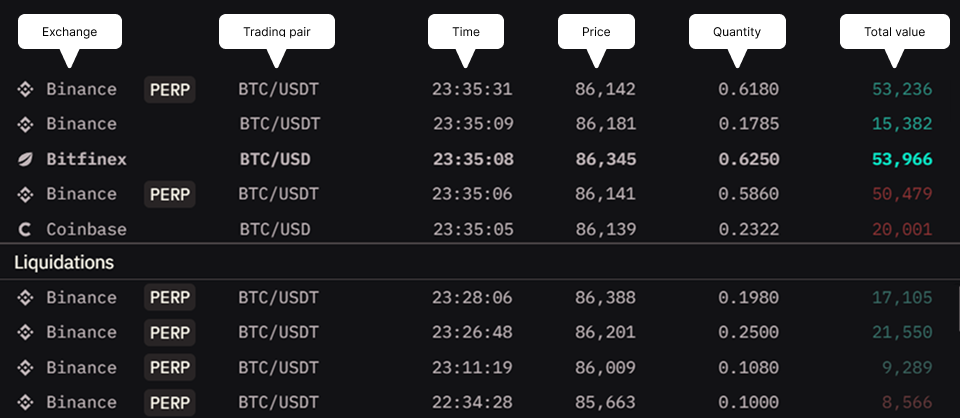
Trade Information
Each trade entry shows:
- Exchange - The platform where the trade occurred
- Trading Pair - The cryptocurrency pair being traded (includes market type like PERP for perpetuals)
- Time - Timestamp when the trade was executed
- Price - The execution price of the trade
- Quantity - Amount of the asset traded
- Total Value - Dollar value of the transaction (Quantity × Price)
Responsive behavior: When widget width is limited, some columns may hide automatically to preserve essential data. Make the widget wider to restore all columns.
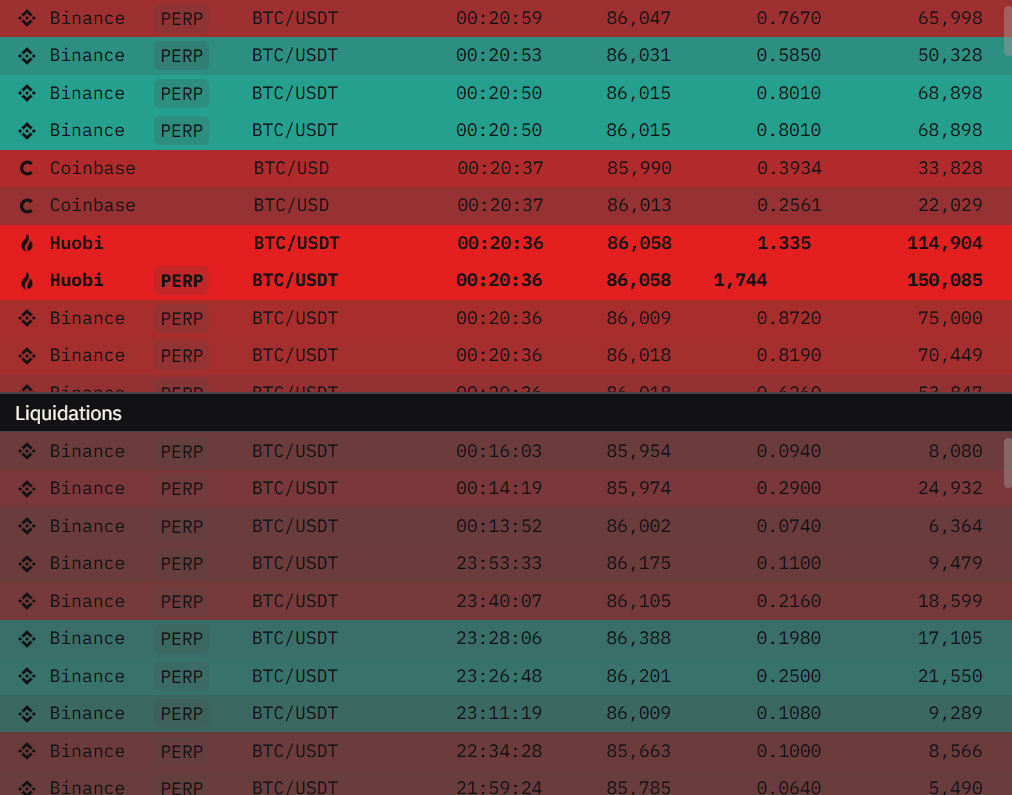
Visual Indicators
Color coding:
The widget uses colors to indicate which side initiated the trade (the market taker):
- Green - Buy orders (market takers buying, executed against ask liquidity)
- Red - Sell orders (market takers selling, executed against bid liquidity)
For liquidations:
- Green - Short liquidations (shorts forced to close, buying pressure)
- Red - Long liquidations (longs forced to close, selling pressure)
Note: Green and red colors mentioned are from the default theme. Your active theme may use different colors for bid (buy) and ask (sell) sides.
Intensity variation: Color intensity increases based on how much the trade value exceeds your threshold. Trades just above the threshold appear with lighter colors, while trades significantly exceeding it display with more vibrant, intense colors.
Quick scanning: The color intensity helps you instantly identify which trades are moving the market. Brighter colors = larger trades relative to your threshold = more impact.
Sections
The widget is divided into two main sections:
Regular Trades Section
Displays spot and derivatives market transactions based on your filter settings.
Liquidations Section
Shows liquidation events separately at the bottom of the widget, filtered by your liquidation threshold setting.
Reading Liquidations: Clusters of liquidations often indicate key support/resistance levels being broken. Large liquidation cascades can signal trend reversals or acceleration.
Interactions
Resizable Sections
The divider between regular trades and liquidations sections can be dragged to adjust their relative sizes.
How to use:
- Hover over the divider line between sections
- Click and drag up or down
- Release to set the new proportions
When to adjust:
- Lots of liquidation activity → Expand liquidations section
- Focus on regular trades → Shrink liquidations section
- Equal interest → Keep roughly 50/50 split
Settings
Display Mode
Choose what type of data to display in the feed.
Options:
- Trades & Liq’s - Shows both trades and liquidations
- Trades - Shows only regular transactions
- Liquidations - Shows only liquidation events
When to use:
- Trades & Liq’s: Complete market picture, general monitoring
- Trades: Focus on organic trading activity without liquidation noise
- Liquidations: Track forced closures and potential cascade events
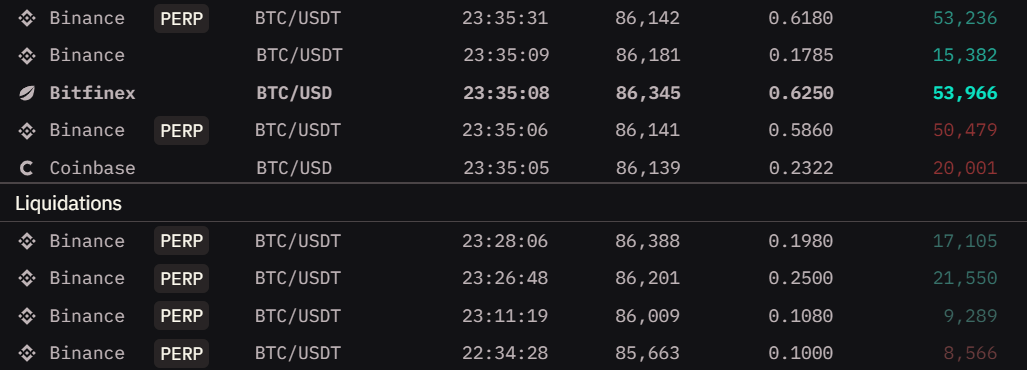
Colorized
Toggle colored highlighting for buy/sell transactions.
When to use:
- ON: Quick visual recognition of market direction and trade flow
- OFF: Clean monochrome view when you prefer minimal visual noise
| Colorized OFF | Colorized ON |
|---|---|
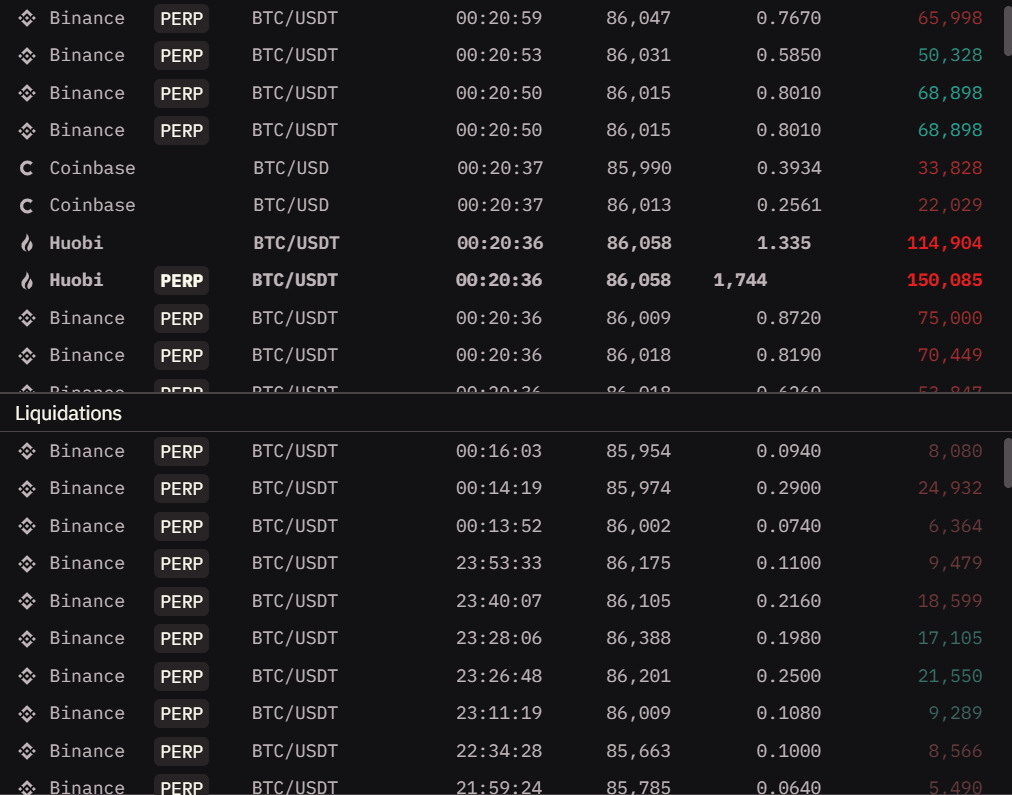 |  |
Extended
Toggle visual grouping feature that hides repeated exchange names and trading pairs for consecutive trades.
What it does: When multiple consecutive trades occur on the same exchange and pair, only the first one shows the full details. Subsequent trades show just price, quantity, and value until the exchange or pair changes.
Benefits:
- Cleaner, more compact display
- Easier to see trade sequences on same market
- Reduces visual clutter during high-activity periods
When to use:
- ON: Monitoring high-volume markets where same pair trades rapidly
- OFF: Need to see full details for every single trade
| Extended OFF | Extended ON |
|---|---|
 | |
Sound
Control audio notification volume for new trades using the slider.
How it works:
- Adjust volume from silent to maximum using the slider control
- Different audio tones play for buys versus sells
- Alert intensity varies proportionally with trade size relative to threshold
- Larger trades = louder alerts
When to use:
- High volume: Passive monitoring while doing other tasks, want to hear significant trades clearly
- Low volume: Background awareness without distraction
- Silent (minimum): Visual monitoring only, no sound alerts
Note: High-volume markets can generate frequent alerts. Consider using higher thresholds to avoid alert fatigue.
Trades (Spot)
Set minimum dollar value threshold for displaying spot market trades. Only trades with total value exceeding this amount will appear in the feed.
Purpose: Filter out small trades to focus on significant transactions that actually move the market.
Recommended settings:
- Low ($1,000-$5,000): See all activity, even small retail trades
- Medium ($10,000-$50,000): Filter noise, focus on meaningful trades
- High ($100,000+): Only whale activity and major market moves
Tip: Adjust threshold based on market cap - use lower thresholds for smaller altcoins, higher for major pairs like BTC/ETH.
Trades (Derivatives)
Set minimum dollar value threshold for displaying derivatives market trades (perpetuals and futures). Only trades with total value exceeding this amount will appear in the feed.
Why separate from spot: Derivatives markets often have different liquidity characteristics and trade sizes compared to spot markets.
Strategy: You might want to see smaller spot trades but only large derivatives trades, or vice versa.
Liquidations
Set minimum dollar value threshold for displaying liquidation events. Only liquidations with total value exceeding this amount will appear in the feed.
Why it matters: Liquidations provide key market insights:
- Large liquidations can trigger cascades
- Liquidation clusters indicate overleveraged positions
- Can signal trend continuation or reversal
Recommended settings:
- Low ($10,000-$50,000): Track all liquidation activity
- Medium ($100,000-$500,000): Focus on significant forced closures
- High ($1,000,000+): Only major liquidation events
Tip: During volatile periods, lower your liquidation threshold to see the full cascade pattern. During quiet periods, raise it to focus only on outliers.